Fig. 1.

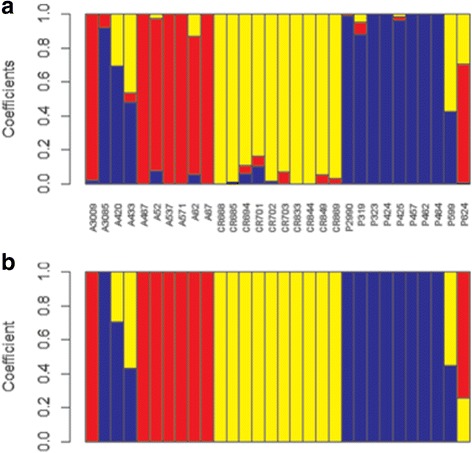
Structure analysis using sNMF(a) and NgsAdmix (b). Each color represents one population. The length of each segment in each vertical bar represents the proportion of ancestry in each population

Structure analysis using sNMF(a) and NgsAdmix (b). Each color represents one population. The length of each segment in each vertical bar represents the proportion of ancestry in each population