Fig. 2.

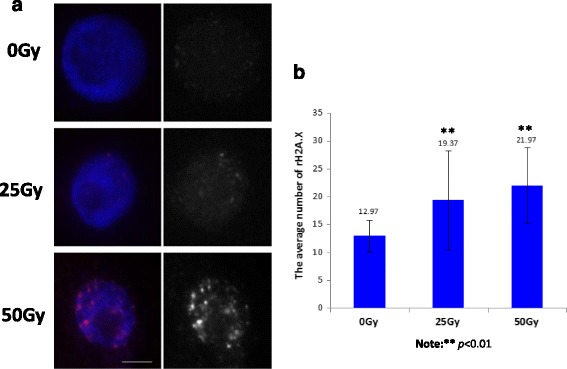
Immunofluorescence assay of γ-H2A.X phosphorylation foci after 50 Gy treatment. a Root tips were collected from the seedlings 12 h post-IR treatment with the dosages as indicated (0, 25, 50 Gy) for immunoassay with the homemade anti-γ-H2AX phosphorylation antibody. DAPI stained nuclei and immunosignals derived from anti-γ-H2AX phosphorylation antibody were observed and recorded under a fluorescence microscope (Olympus DP80). The merged colorful images were generated as indicated. The blue signal was derived from DAPI stained nuclei; the black and white image was generated from the nuclei stained with anti-γ-H2AX phosphorylation antibody with IR treatments as indicated. Bar, 10 μm. b The statistical assay of γH2A.X immunosignals. Foci of γH2A.X immunosignals were counted from 30 individual nuclei, which were prepared from root tips of the seedling post-IR treatment with indicated dosages (0, 25, 50 Gy) for 12 h. A statistical analysis was performed using the t-test, where **p < 0.01. The x-axis represents the IR dosage; the y-axis represents the average number of γH2A.X foci
