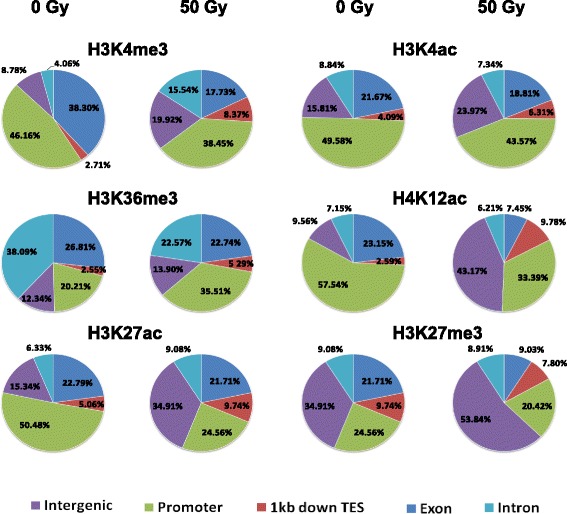
Fig. 4.

Genomic distribution of IR-induced ChIP-seq peaks from each indicated mark specific for 0 and 50 Gy. Each pie chart contains five sub-genomic regions, including promoters, exons, introns, 1 kb downstream of the TES and intergenic regions with at least 1 kb away from the TSS or TES. Each sub-genomic locus was indicated by using a different color
