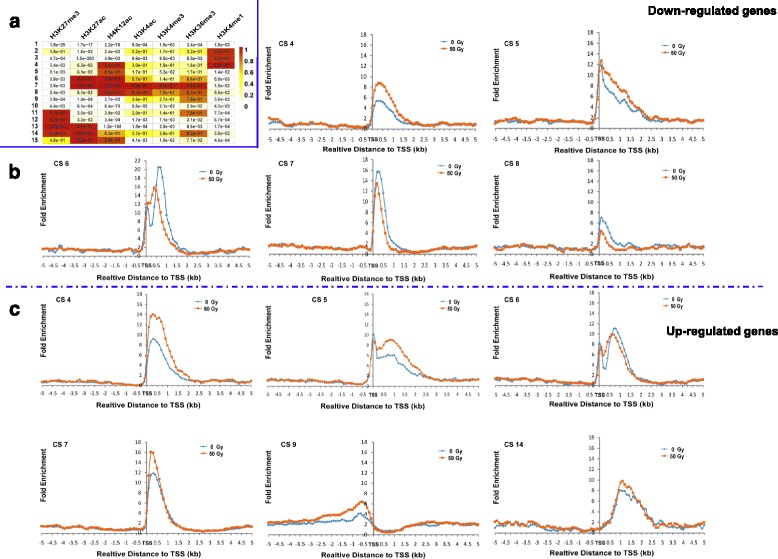
Fig. 6.

Distribution of chromatin states across 5 kb up- and down-stream of the TSS of differentially expressed genes. a Chromatin states analyzed by ChromHMM. The genome-wide chromatin state (CS) was divided into fifteen sub-groups according to the combination of 7 marks as indicated in each group. b Distribution of indicated CS across the control and the corresponding down-regulated genes. The x-axis represents the position relative to the TSS; the y-axis represents fold enrichment of the corresponding CS. c Distribution of indicated CS across the control and the corresponding up-regulated genes. The x-axis represents the position relative to the TSS; the y-axis represents fold enrichment of the corresponding CS. The blue solid line for separating (a) and (b), and the dot and dash line for separating (b) and (c)
