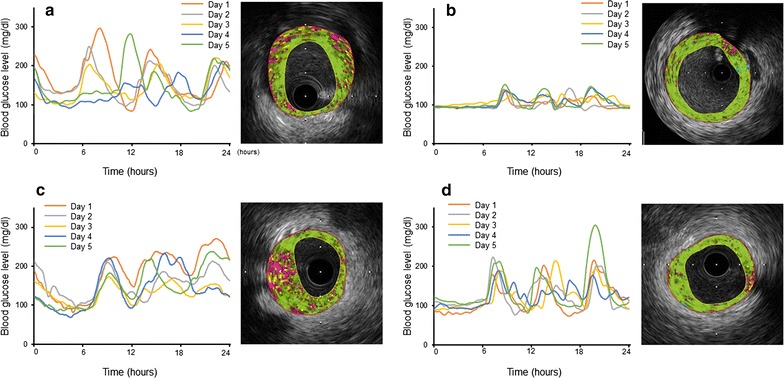
Fig. 4.

Representative daily variations in blood glucose level measured continuously by CGM over a period of 5 days (left) and iMap-coronary intravascular ultrasound images (right). a A patient with eGFR ≥ 60 ml/min/1.73 m2, high MAGE (98.5 mg/dl) and intermediate level of TNF-α (1.1 pg/ml). b A patient with eGFR ≥ 60 ml/min/1.73 m2, low MAGE (29.6 mg/dl) and intermediate level of TNF-α (1.2 pg/ml). c A patient with eGFR < 60 ml/min/1.73 m2, intermediate level of MAGE (74.8 mg/dl) and high TNF-α (2.4 pg/ml). d A patient with eGFR < 60 ml/min/1.73 m2, intermediate level of MAGE (84.3 mg/dl) and low TNF-α (0.8 pg/ml). The fibrotic, lipidic, necrotic and calcified components in each image were: a Fibrotic 58%, Lipidic 14%, Necrotic 26%, Calcified 2%. b Fibrotic 75%, Lipidic 7%, Necrotic 17%, Calcified 1%. c Fibrotic 46%, Lipidic 15%, Necrotic 36%, Calcified 3%. d Fibrotic 80%, Lipidic 7%, Necrotic 12%, Calcified 1%
