Fig. 6.

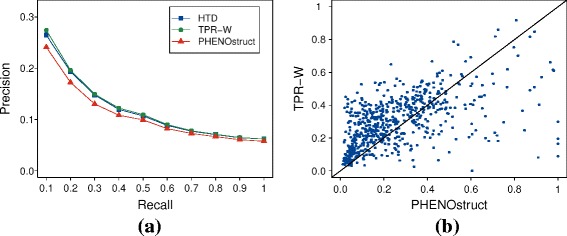
(a) Compared precision at different recall levels averaged across 2444 HPO terms. (b) Scatter plot of F max values. Each point represent one of the 608 genes of the test set. PHENOstruct values are in abscissa, TPR-W values in ordinate

(a) Compared precision at different recall levels averaged across 2444 HPO terms. (b) Scatter plot of F max values. Each point represent one of the 608 genes of the test set. PHENOstruct values are in abscissa, TPR-W values in ordinate