Fig. 7.

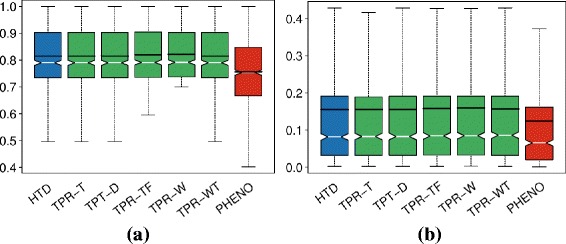
Distribution of the AUROC and AUPRC values across the best predicted terms (778 HPO terms). a AUROC, b AUPRC. HTD and different TPR variants are compared with PHENOstruct

Distribution of the AUROC and AUPRC values across the best predicted terms (778 HPO terms). a AUROC, b AUPRC. HTD and different TPR variants are compared with PHENOstruct