Fig. 2.

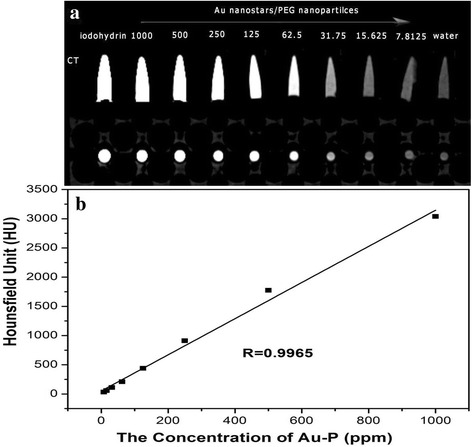
The X-ray attenuation intensity of the AuNS@PEG nanoparticles as a function of the Au concentration (a) and CT image of the AuNS@PEG nanoparticles under different concentrations (iodohydrin, 1000, 500, 250, 125, 62.5, 31.75, 15.625, and 7.8125 ppm, respectively) (b)
