Fig. 4.

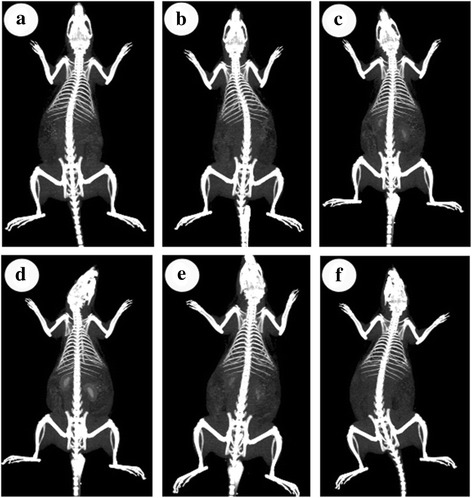
CT images of rat before injection (a) and at different time points (0.5, 1, 2, 6, and 24 h) (b–f) after intravenous injection of AuNS@PEG nanoparticles (200 ppm)

CT images of rat before injection (a) and at different time points (0.5, 1, 2, 6, and 24 h) (b–f) after intravenous injection of AuNS@PEG nanoparticles (200 ppm)