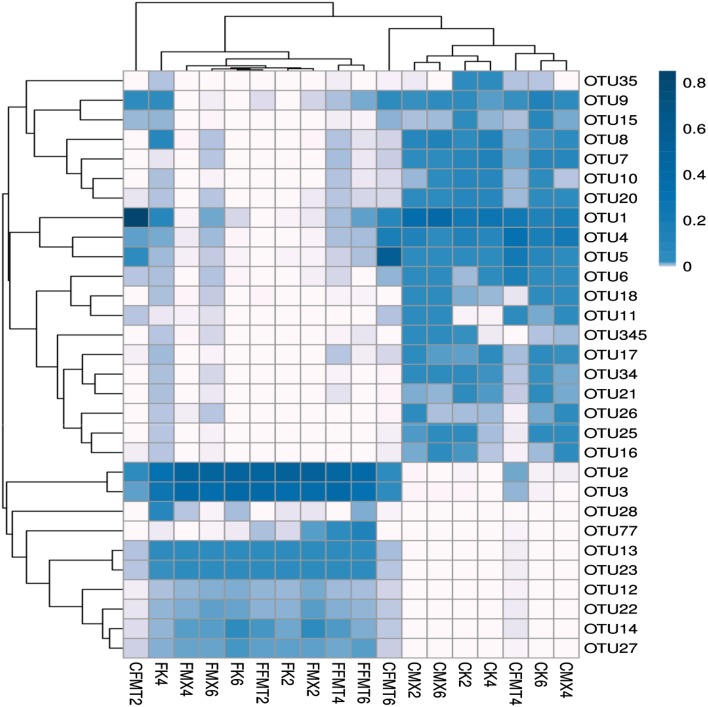
Fig. 3.
OTU heatmap of all the samples. Thermal analysis provides abundant information of the selected OTU, further demonstrating the similarity and differences among these data, including the 30 OTUs with the highest default abundances. The left names are OTU ID, and the color value of each square for each row indicates the relative abundance of OTU

