
Fig. 2.
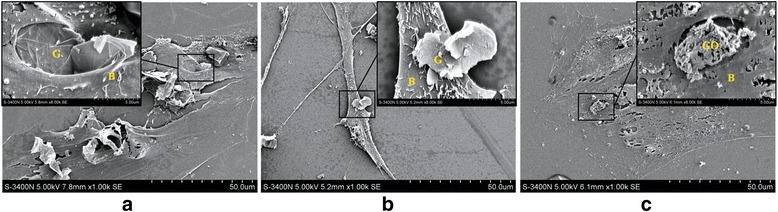
SEM images of co-culture of G, GO, and BMSCs. a G group, 10 μg/ml. The cells are in good condition. b G group, 50 μg/ml. Cell size decreases, surface secretion increases, and microvillus on the cell surface becomes long. c GO group, 50 μg/ml. BMSCs shrink and deform. G graphene, GO graphene oxide, B BMSCs