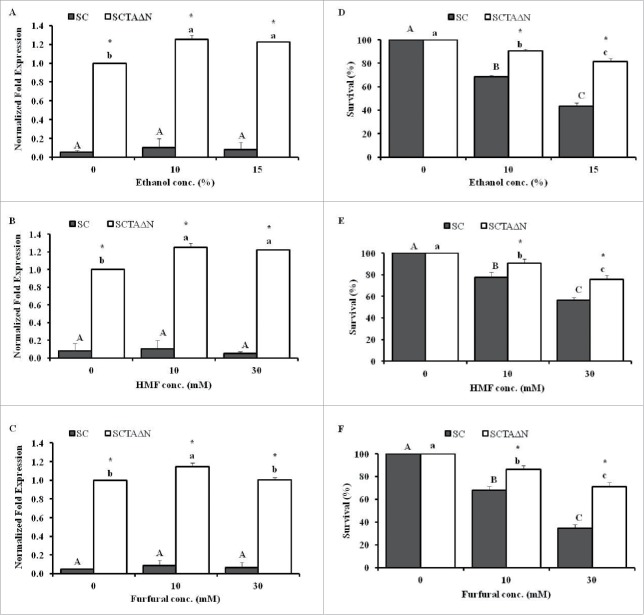
Figure 3.
Quantitative real-time PCR analysis (A, B, C) and percentage survivors (D, E, F) of SC and SCTAΔN grew in a YPD broth with ethanol conc. (0%, 10%, and 15%) for tps1 gene (A, D), HMF conc. (0 mM, 10 mM, and 30 mM) for ari1 gene (B, E) and furfural conc. (0 mM, 10 mM, and 30 mM) for ari1 gene (C, F). Data are presented as the means ± SD (n = 3). *Significantly higher than the other group. One-way ANOVA, Student's t test, p < 0.05. Bar values with the different letters (A, B, C for SC and a, b, c for SCTAΔN) are significantly different. One-way ANOVA, Duncan's multiple range tests, p < 0.05.

