
Figure 6.
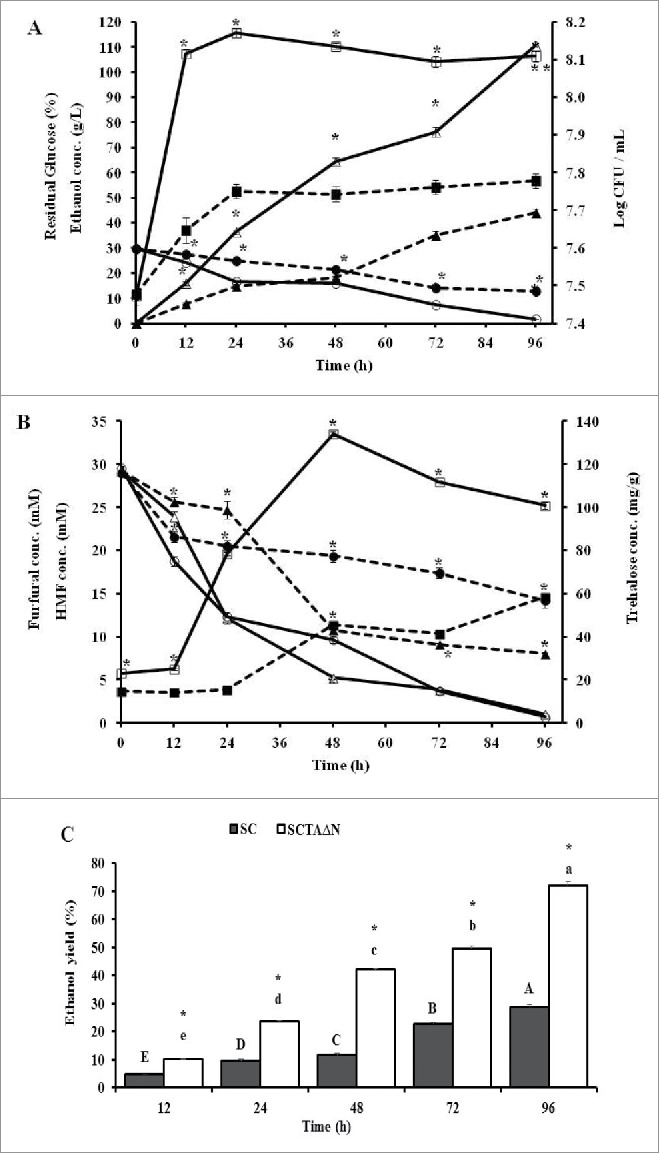
Ethanol production capacities of wild strain (SC) and engineered strain (SCTAΔN) grown in YP broth (10 g/L yeast extract, 20 g/L peptone) containing 30 % glucose, 30 mM furfural and 30 mM HMF. Data are presented as the means ± SD (n = 3). *Significantly higher than the other group. One-way ANOVA, Student's t test, p < 0.05. Bar values of the ethanol yield (%) with the different letters (A, B, C, D, E, F for SC and a, b, c, d, e, f for SCTAΔN) are significantly different. One-way ANOVA, Duncan's multiple range tests, p < 0.05. A: Ethanol concentration in g/L ( SC;
SC;  SCTAΔN), residual glucose concentration in % (
 SC;
SC;  SCTAΔN) and biomass Log CFU/mL (
 SC;
SC;  SCTAΔN). B: HMF concentration in mM (
 SC;
SC;  SCTAΔN), furfural concentration in mM (
 SC;
SC;  SCTAΔN) and Trehalose concentration in mg/g dry cells weight (
 SC;
SC;  SCTAΔN). C: Ethanol yield (%) until 96 h of incubation.