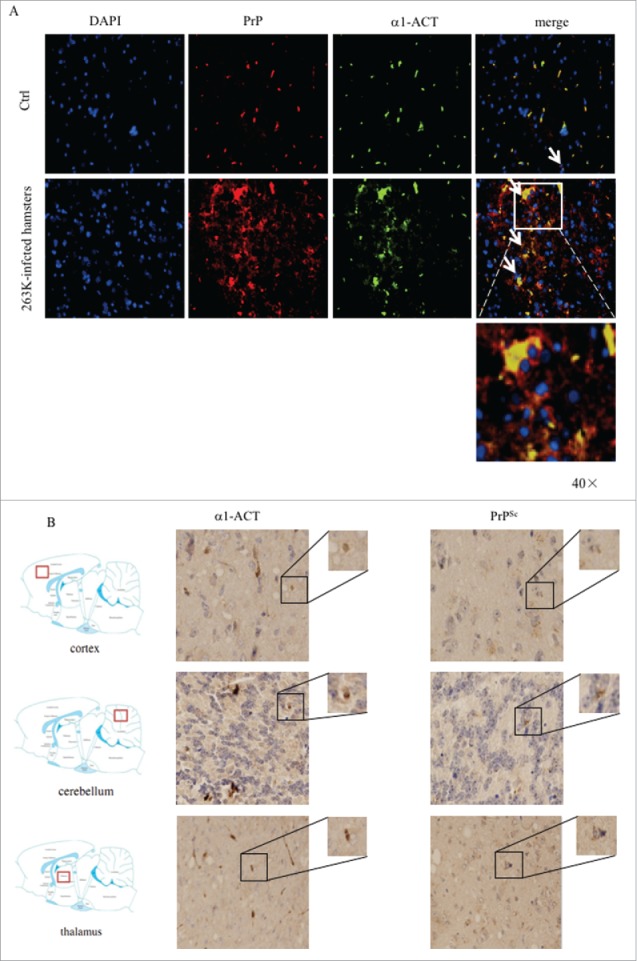
FIGURE 4.

Analyses of the association of α1-ACT with PrP in brain tissues. a Representative images of double-stained IFA assays with the antibodies of α1-ACT (green) and PrP (red) on the brain sections of normal and 263K-infected hamsters (100 ×). The zoomed-in pictures are shown on the bottom. b Representative images of IHC assays for α1-ACT and PrPSc in the serial sections of different brain regions of 263K-infected hamsters, including cortex, thalamus and cerebellum (indicated above). The magnified images are shown on the top right of each picture and the positions of the observing fields within the whole brain are indicated on the left.
