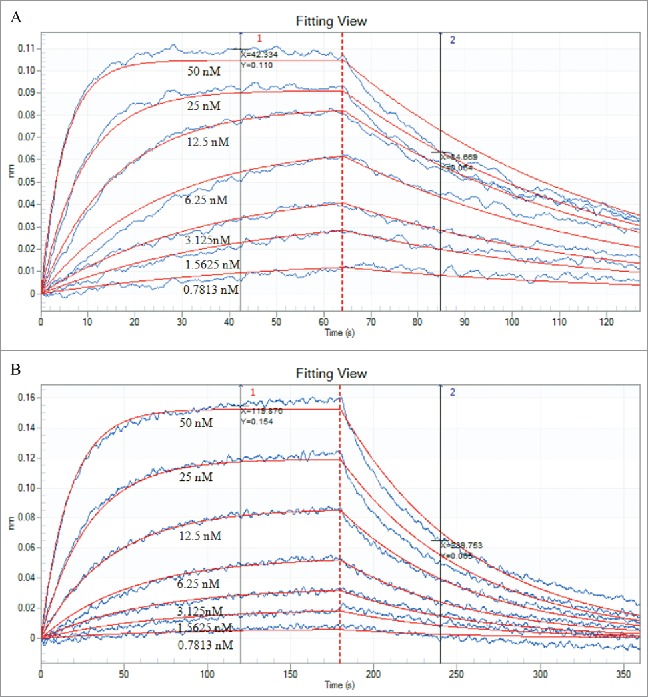
Figure 6.

Data of affinity interactions between TGF-β1 and eTGFBR2 (A) or HSA-eTGFBR2 (B). The binding affinity of TGF-β1 was determined using 2-fold serial dilutions of eTGFBR2 and HSA-eTGFBR2 at concentrations of 0.7813–50 nM. Both of the TGF-β1 was in the same concentration of 1 μg/mL.
