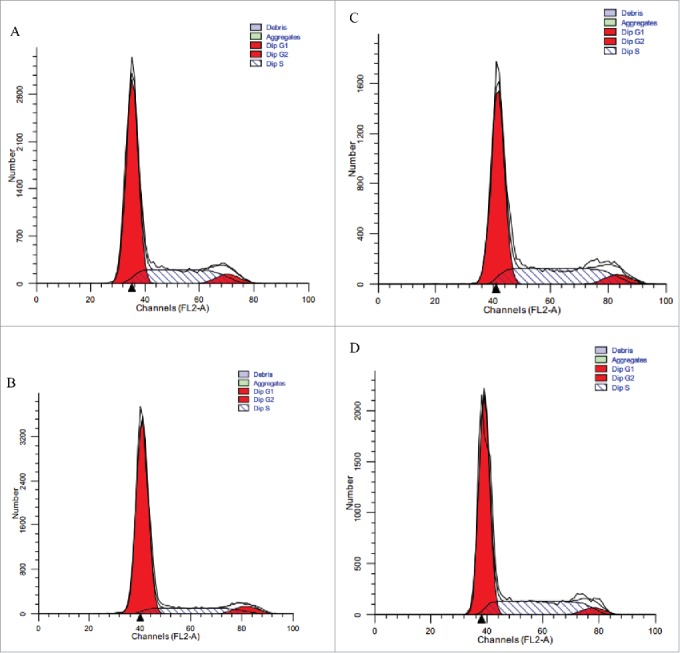
Figure. 8.

Flow cytometry analysis of L-02 cells in the presence of TGF-β1 with or without HSA-eTGFBR2 for 24 h. (A) RPMI-1640 medium for negative control; (B) 0.4 nM TGF-β1 for positive control; (C) TGF-β1 plus 30 nM eTGFBR2; (D) TGF-β1 plus 30 nM HSA-eTGFBR2.
