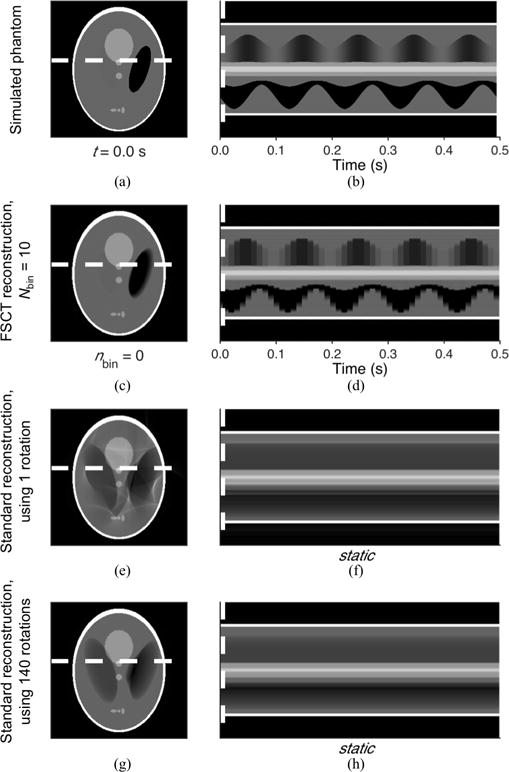
Fig. 4.

Comparison between standard CT reconstruction (e,g) and FSCT reconstruction (c) of the simulated phantom oscillating at 9.924 Hz (a). A transient profile shown through a single row (white dashed line) is provided for the simulated phantom (b) and FSCT reconstructed image (d), resolving periodic motion over multiple 9.924 Hz oscillation cycles. A static profile through the same row is provided for the standard reconstructed images (f,h).
