
Fig. 5.
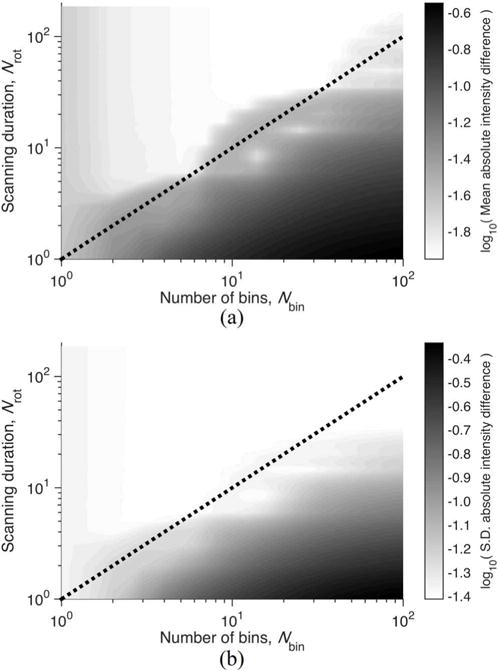
Contours of error in FSCT reconstructed image of simulated phantom for varying selection of scanning duration Nrot and number of bins Nbin. Error was assessed by (a) mean and (b) standard deviation of voxel-wise absolute intensity difference between the reconstructed image and the phantom image across all reconstructed phase bins. The lower bound for adequate sampling given by (17), is indicated by the dashed line, using Ndet = 1000, Npro = 1600, frot = 3.509 Hz, fsub = 9.924 Hz.