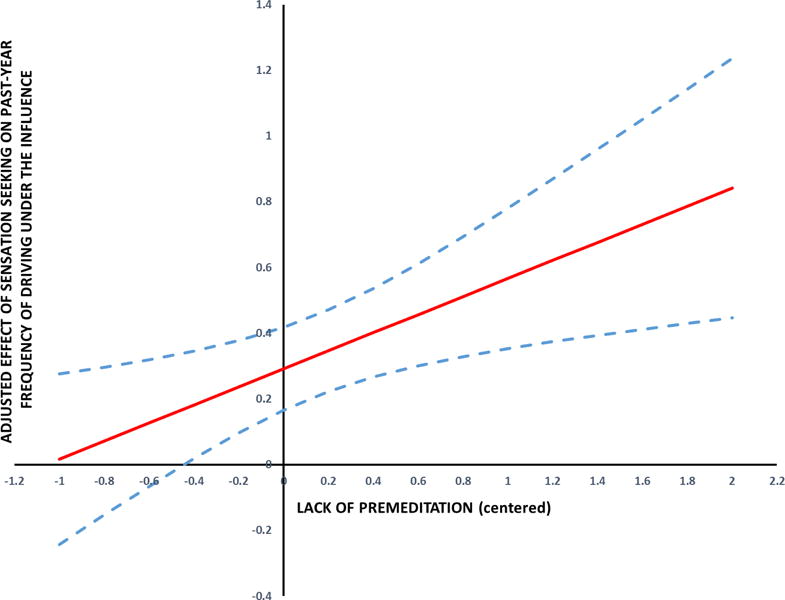
Figure 1.

Johnson-Neyman plot. The solid line represents values of the adjusted effect of sensation seeking on past-year frequency of driving under the influence (controlling for all variables in the Final Model 3) across all observed values of lack of premeditation (centered). The curved dashed lines represent the 95% confidence bands around the adjusted effect of sensation seeking on past-year frequency of driving under the influence.
