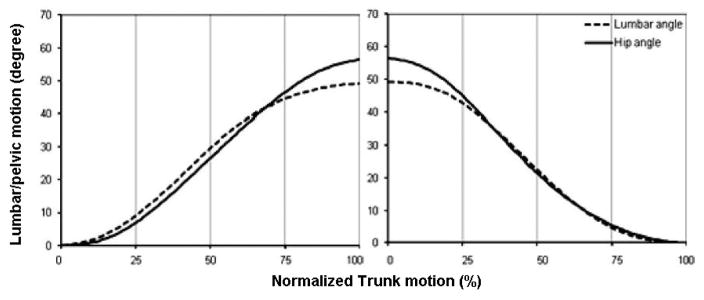
Figure 4.
Plotting lumbar and pelvic motions as functions of normalized trunk motion allows a qualitative comparison of the contribution of lumbar and pelvis motion to trunk motion. For any given instant of motion, when the lumbar curve is above (below) the pelvic curve, it means that up to that point in time the total contribution of lumbar to trunk motion has been larger (smaller) than pelvis. The pelvic contribution in example shown here [23] is characterized locally with respect to thigh (i.e., hip flexion).

