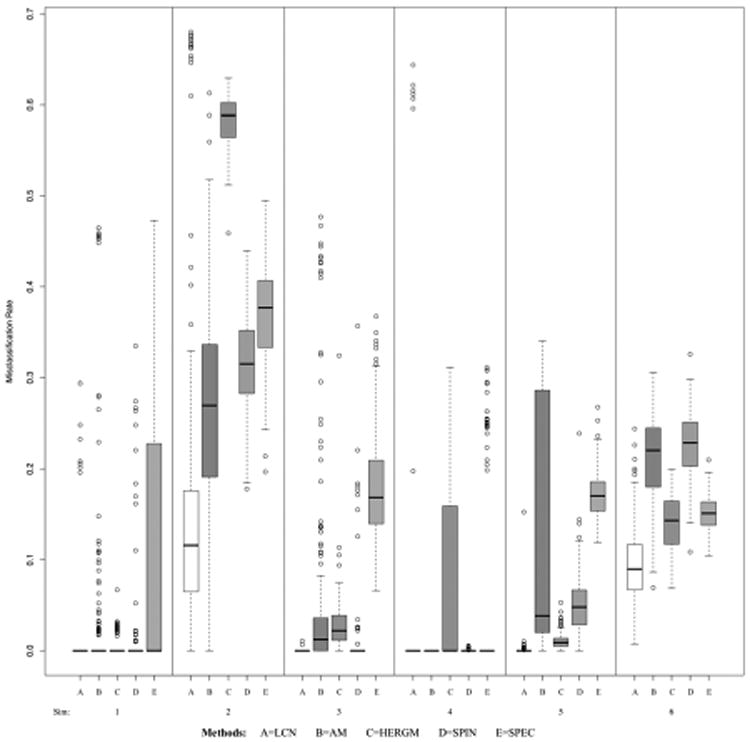
Figure 2.

Boxplots of misclassification rates by simulation scheme. The 6 schemes, each with 200 simulated datasets, are listed in Table 1. Misclassification rate is defined as the sum of the false positives and false negatives divided by the total number of possible node pairs.
