
Figure 3.
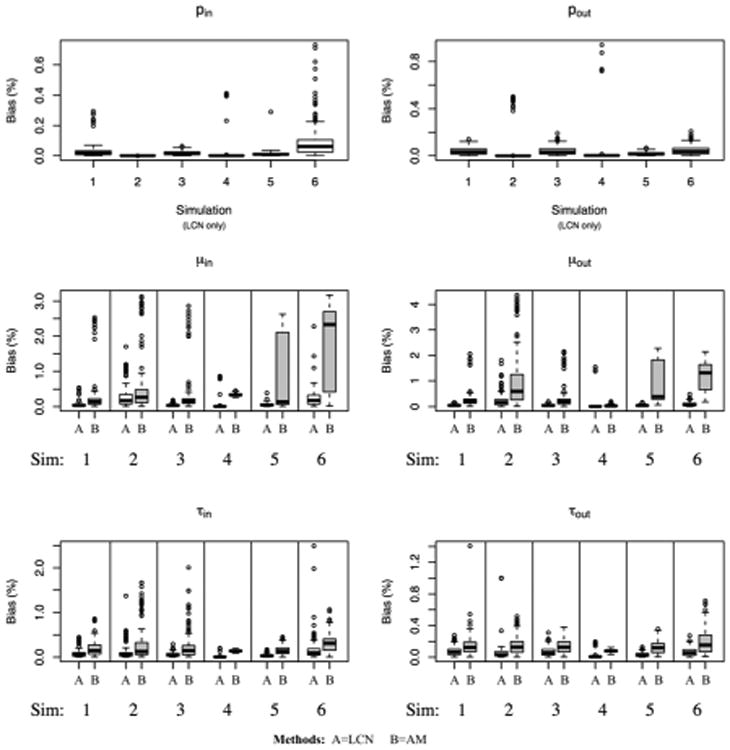
Absolute deviation between the posterior median of each parameter and the true value, scaled by the true value, from each of the 6 schemes listed in Table 1. For the edge parameters μin, μout, τin, τout, results from our Bayesian random graph model (A – on the left of each panel) are compared to the method of Ambroise and Matias (B – on right).