
Figure 7.
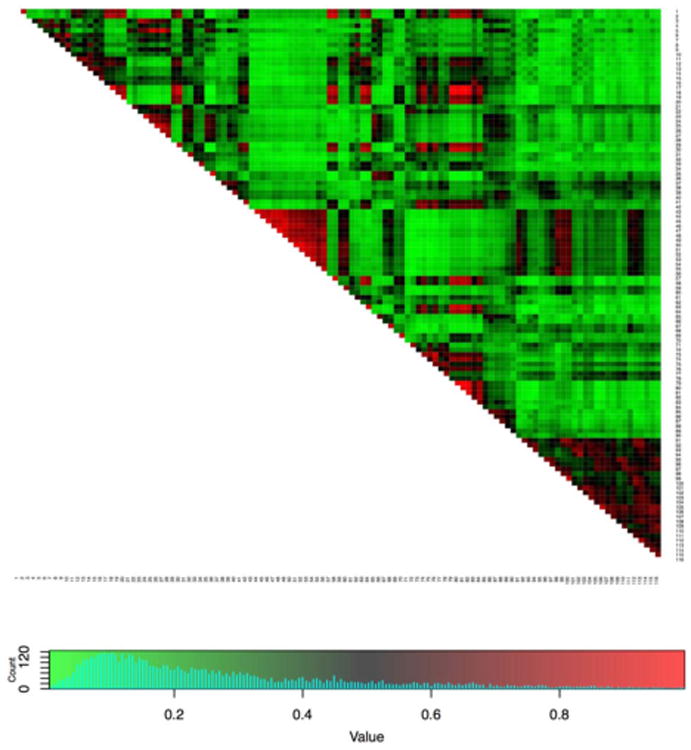
Overlap of the latent class structure across 185 subjects from the ADHD-200 sample. Each element of the matrix is the proportion of all 185 subjects in whom the corresponding two nodes fall in the same estimated latent class. The list of ROIs is given in Table 2 in the Appendix.