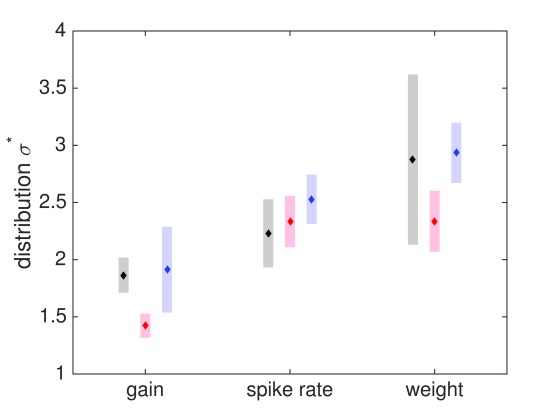
Figure 15. Experimental and generated distribution widths for spike rates, gains and weights.
Grey, experimental measurements (s. Tables); red, generated with 100% Hebbian learning; or blue, 80% Hebbian and 20% homeostatic learning combined. The basic distinction in distribution width for gains, rates, weights is reproduced with Hebbian learning, additional homeostatic learning matches experimental values best.

