
Fig. 7. GSPE:Aβ interactions.
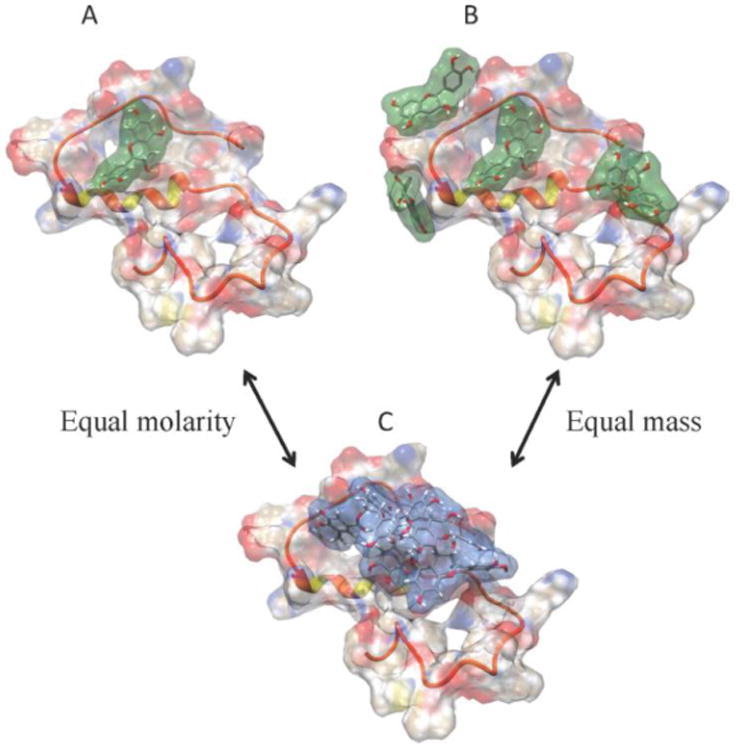
A model of GSPE:Aβ interactions was created to illustrate the potential differences between systems in which GSPE fractions were studied at equimolar concentrations or at equal weight concentrations. A partially folded Aβ40 structure derived using solution-state NMR (PDB: 2LFM) is shown as a semi-transparent surface where red represents negative charges near the surface and blue represents positively charges. The white regions correspond to essentially neutral potentials. The protein backbone is displayed using ribbon representation. GSPE monomer (green) or oligomer (blue) are shown as stick structures, in which red represents oxygen and white represents hydrogen. Panels are: (A) A single monomer docked to Aβ 40; (B) four monomers docked to Aβ40; and (C) a single oligomer docked to Aβ40. Comparison between (A) and (C) illustrates equal molarity of GSPE's whereas comparison between (B) and (C) illustrates equal masses of GSPEs.