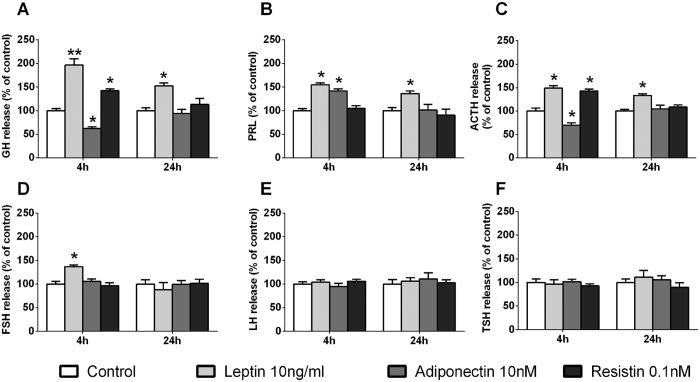
Figure 3. Time response (4 h and 24 h; n = 5 and n = 4, respectively) of leptin (10 ng/ml), adiponectin (10 nM) or resistin (0.1 nM) on GH, PRL, ACTH, FSH, LH and TSH secretion in primary pituitary cell cultures from baboons.
Data are expressed as percent of control (set at 100%) and represent the mean ± SEM (n = 4–5 individual experiments, 3–4 wells/experiment). Asterisks indicate values that significantly differ from their respective control values *p < 0.05, **p < 0.01.

