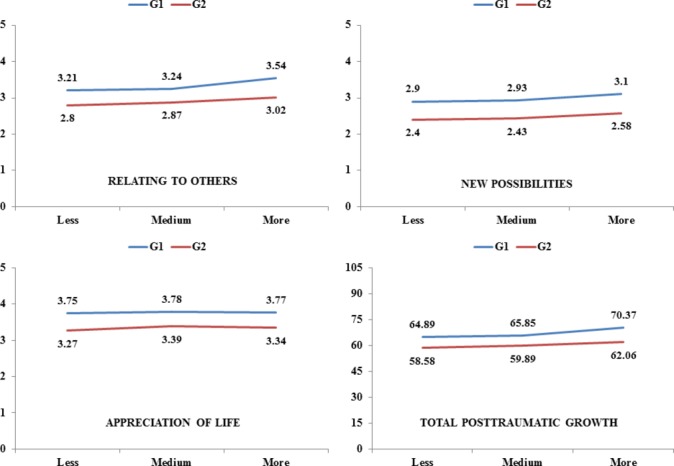
Figure 4.

Post-traumatic growth: mean scores on variables with statistically significant differences between the two groups. Higher scores show more growth. G1, liver transplant recipients (n=216); G2, caregivers (n=216).

Post-traumatic growth: mean scores on variables with statistically significant differences between the two groups. Higher scores show more growth. G1, liver transplant recipients (n=216); G2, caregivers (n=216).