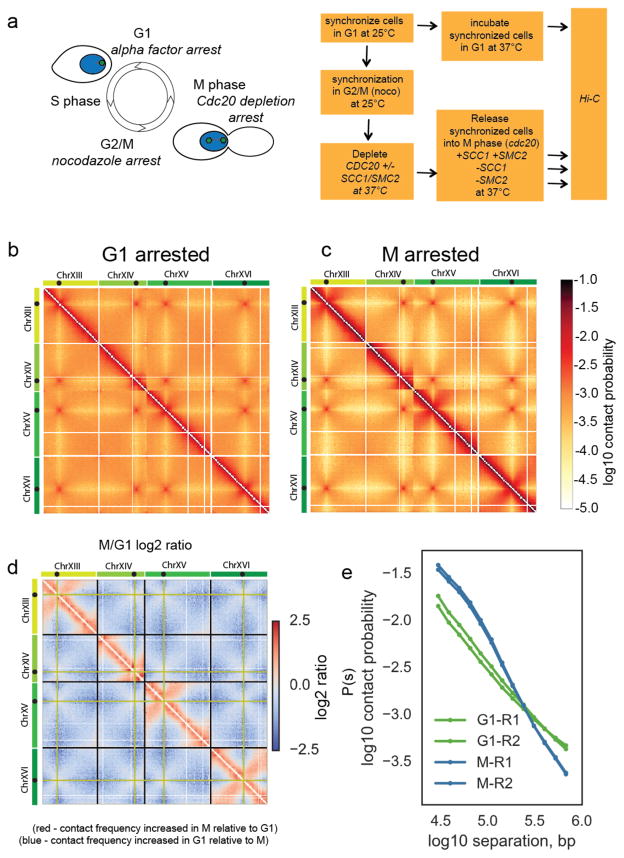
Figure 1. Budding yeast chromosomes are compacted in mitosis.
a) Experimental procedure to synchronize cells in either G1 or M, with and without cohesin and condensin. Green spots in cartoon on the yeast nucleus (blue) represent spindle pole bodies.
b) Hi-C contact heatmap from G1 cells synchronously arrested at 37°C with alpha factor. The Hi-C contact map for chromosomes XIII to XVI is shown as representative of the whole genome. Contact maps for each condition were assembled from two independent experiments. Side bars show relative size of chromosomes XIII, XIV, XV and XVI with black dots on chromosomes showing locations of centromeres on each chromosome.
c) Hi-C contact heatmap from cells arrested in M phase by depletion of Cdc20 at 37°C. Both Hi-C maps have been normalized by iterative correction at 10kb resolution. Heatmap colour scale represents log10 number of normalized contacts. The Hi-C contact map for chromosomes XIII to XVI is shown as representative of the whole genome.
d) Log2 (M/G1) ratio of the data displayed in b and c. Regions where contact frequency was higher in M than G1 are shown in red, regions where contact frequency was lower in M than G1 in blue. Black guidelines show ends of chromosomes. Pale green lines indicate the bin containing the centromere.
e) Contact probability, P(s), as a function of genomic separation, s, for G1 and M phase cells averaged over all chromosomes. The P(s) from each of the two independent experiments for each condition are shown.

