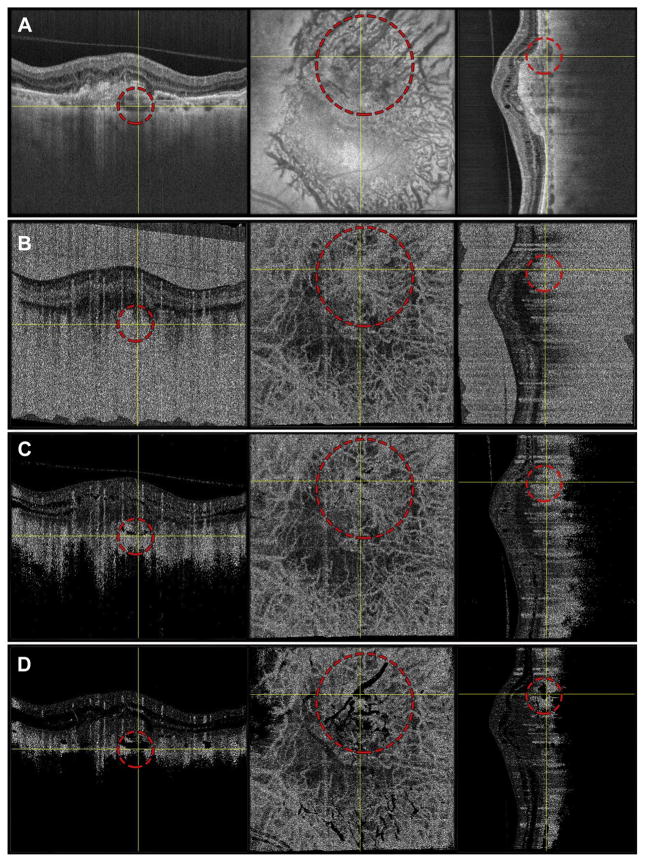
Figure 5.
Case 2: A 78-year-old patient with exudative age-related macular degeneration. To co-locate the same features on both en face and cross-sectional slices, data were viewed in an orthoplane manner; for each row in this figure, the left panel corresponds to a B-scan along the fast scan direction, the middle panel corresponds to an en face plane, and the right panel corresponds to a B-scan along the slow scan direction. For each panel, the yellow crosshairs indicate the locations of the views in the other 2 panels in that row. The red dashed circle demarcates a choroidal vessel. Row A shows the OCT images; row B, the unthresholded OCT angiography (OCTA) images; row C, the choroidal thresholded OCTA data; and row D, the retinal thresholded OCTA data.

