Figure 7.
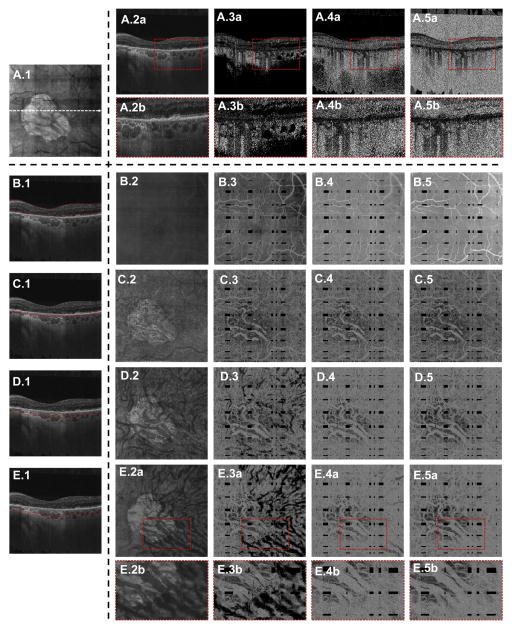
Case 4: A 77-year-old patient with nonexudative age-related macular degeneration with geographic atrophy (GA). A.1, En face mean projection through the entire OCT volume. The cross-sectional OCT/OCT angiography (OCTA) B-scans in A.2, A.3, A.4, and A.5, as well as in B.1, C.1, D.1, and E.1, are extracted from the dashed white arrow in A.1. A.2a, Extracted OCT B-scan. A.3a, Extracted choroidal thresholded OCTA B-scan. A.4a, Extracted retinal thresholded OCTA B-scan. A.5a, Extracted unthresholded OCTA B-scan. The enlargements A.2b, A.3b, A.4b, and A.5b correspond to the dashed red boxes in A.2a, A.3a, A.4a, and A.5a, respectively. The enlargement A.3b shows circular areas of low OCTA signal corresponding to the choroidal vasculatures; these features are not present in A.4b and A.5b. B–E, En face illustration of thresholding. The red lines in B.1, C.1, D.1, and E.1 correspond to the contours between which the OCT(A) signal was projected to form the en face images in B.2–B.5, C.2–C.5, D.2–D.5, and E.2–E.5, respectively. The en face projections B.2, C.2, D.2, and E.2 are projections of the OCT volume; the en face projections B.3, C.3, D.3, and E.3 are projections of the choroidal thresholded OCTA volume; the en face projections B.4, C.4, D.4, and E.4 are projections of the retinal thresholded OCTA volume; and the en face projections B.5, C.5, D.5, and E.5 are projections of the unthresholded OCTA volume. The enlargements E.2b, E.3b, E.4b, and E.5b are taken from the dashed red boxes in E.2a, E.3a, E.4a, and E.5a, respectively. The enlargement E.3b shows how the larger choroidal vasculature has high OCTA signal within the margin of GA, but has low OCTA signal outside of the GA margin; this is because in the region of the GA the retinal pigment epithelium is absent, allowing more light to be incident on the choroid.

