Figure 1.
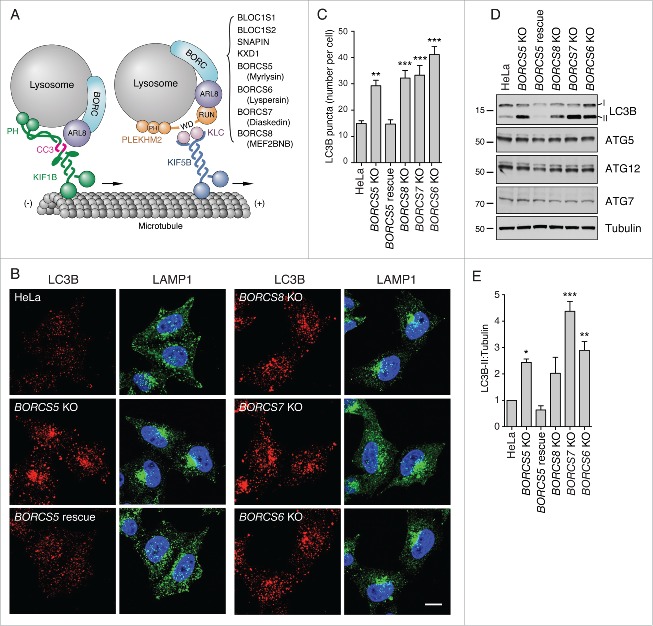
Increased LC3B-II levels in BORC-KO cells. (A) Schematic representation of BORC-ARL8-KIF1 and BORC-ARL8-PLEKHM2/SKIP-KLC-KIF5 machineries for centrifugal movement of lysosomes in non-neuronal cells.21,22 (B) Confocal microscopy of WT, BORCS5-KO, BORCS5-rescue, BORCS6-KO, BORCS7-KO, and BORCS8-KO cells immunostained for endogenous LC3B and LAMP1. Nuclei were stained with DAPI. Scale bar: 10 μm. (C) Quantification of LC3B puncta from experiments as in B. Bars represent the mean ± SEM of puncta per cell from 20 cells in 3 independent experiments. **P < 0.001, ***P < 0.0001, one-way ANOVA, followed by multiple comparisons using the Dunnett test. (D) Cell extracts of WT, BORCS5-KO, BORCS5-rescue, BORCS6-KO, BORCS7-KO, and BORCS8-KO cells were analyzed by immunoblotting with antibodies to the proteins indicated at right. The positions of molecular mass markers (in kDa) are indicated at left. (E) Quantification of LC3B-II levels (normalized to tubulin) from experiments as in E. Bars represent the mean ± SEM from 3 independent experiments. *P < 0.05, **P < 0.01, ***P < 0.0001, one-way ANOVA, followed by multiple comparisons using the Dunnett test.

