
Figure 6.
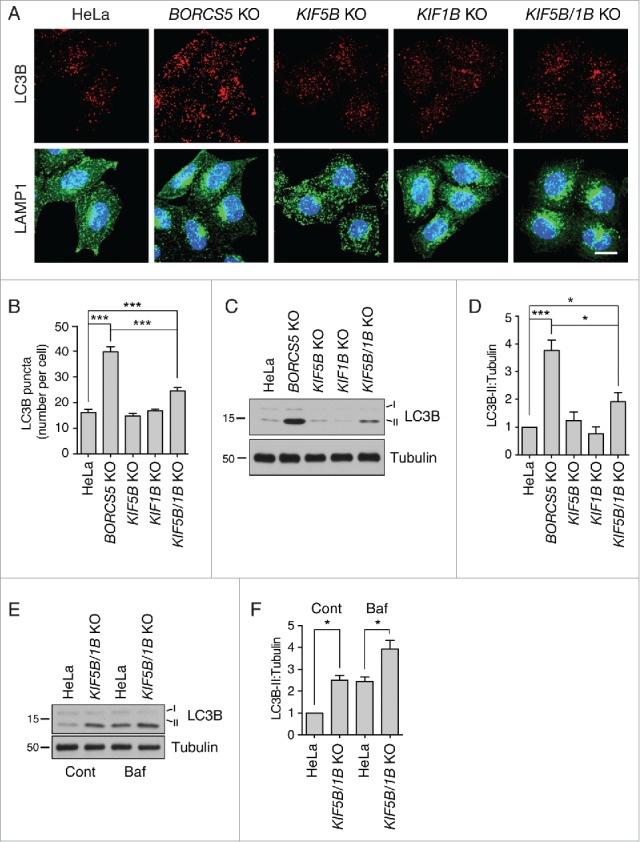
Slight increase in LC3B-II levels in KIF5B KIF1B-double-KO cells. (A) Confocal microscopy of WT, KIF5B-KO, KIF1B-KO and KIF5B KIF1B-double-KO cells immunostained for endogenous LC3B and LAMP1. Nuclei were stained with DAPI. Scale bar: 15 μm. (B) Quantification of LC3B puncta. Bars represent the mean ± SEM of LC3B puncta per cell in 25 cells from 3 independent experiments. ***P < 0.0001, one-way ANOVA, followed by multiple comparisons using the Tukey test. (C) Cell extracts of WT, KIF5B-KO, KIF1B-KO and KIF5B KIF1B-double-KO cells were analyzed by immunoblotting with antibodies to LC3B and tubulin (control). The positions of molecular mass markers (in kDa) are indicated at left. (D) Quantification of LC3B-II normalized to tubulin levels. Bars represent the mean ± SEM LC3B-II/tubulin ratio from 3 independent experiments. *P < 0.01, ***P < 0.0001, one-way ANOVA, followed by multiple comparisons using the Tukey test. (E) WT and KIF5B KIF1B-double-KO cells were treated with no additions or 50 nM Baf for 2 h. LC3B-II and tubulin (control) levels were determined by immunoblotting. The positions of molecular mass markers (in kDa) are indicated at left. (F) Quantification of LC3B-II levels (normalized to tubulin) from experiments as in (E). Bars represent the mean ± SEM from 3 independent experiments. *P < 0.01, one-way ANOVA, followed by multiple comparisons using the Tukey test.