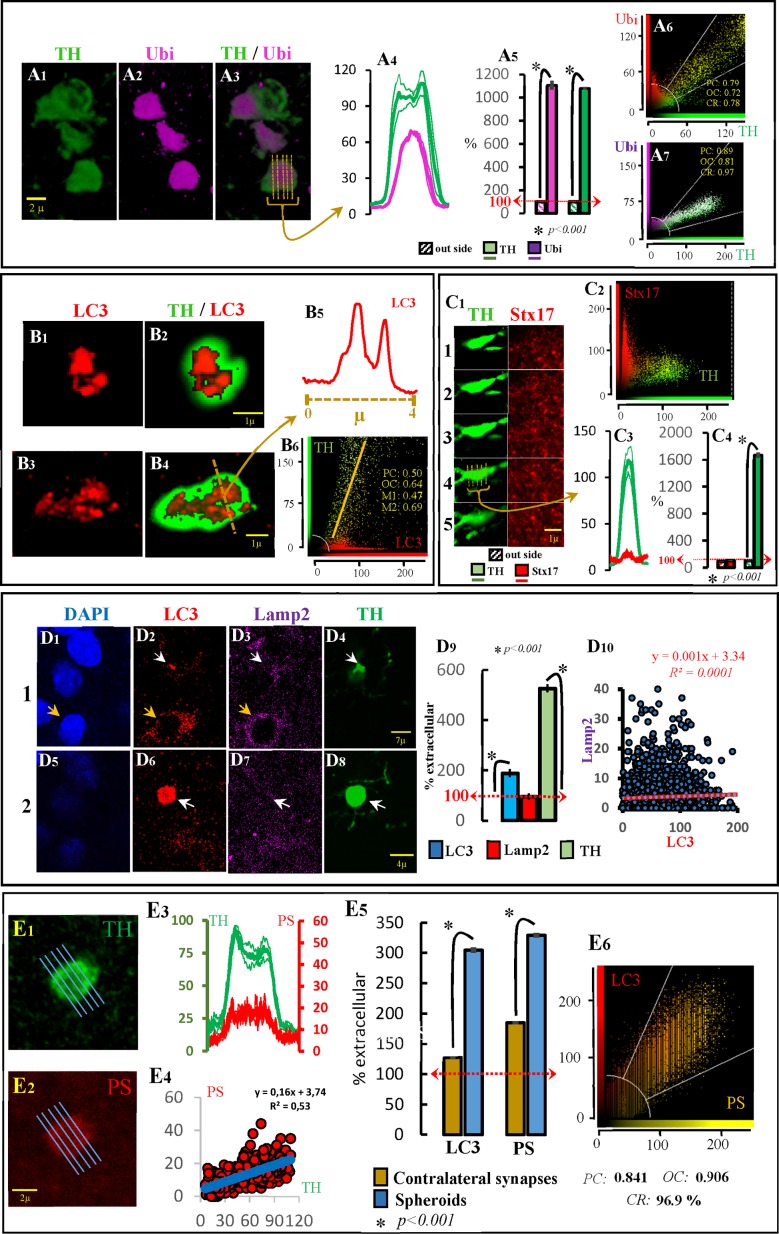
Fig 2. Free-spheroids and autophagy.
The ubiquitin (Ubi) immunoreactivity in spheroids is shown in the A figures. A1 shows three spheroids with marked Ubi immunoreactivity (A2, A3). The distribution of Ubi immunoreactivity in one of these spheroids is shown in A4. Thus, the Ubi and TH immunoreactivity computed in spheroids (n = 200) vs. those recorded in the extracellular space is shown in A5. A6 and A7 show two characteristic examples of Ubi-TH co-localization computed in the denervated striatum. The LC3 immunoreactivity in spheroids is shown in the B figures. B1 and B3 show two examples of LC3 immunoreactivity in TH+ spheroids (B2 and B4 respectively). The distribution of LC3 immunoreactivity across the line indicated in B4 is shown in B5 (vesicular distribution). B6 shows the LC3-TH co-localization computed in the denervated striatum. The syntaxin-17 (Stx17) immunoreactivity in spheroids is shown in the C figures. C1 shows five consecutive slices of a TH+ spheroid with no aggregation of Stx17. C2 shows no LC3-TH co-localization computed in the denervated striatum. C3 shows the Stx17 and TH distribution across slice 4 in fig C1. C4 shows the Stx17 and TH immunoreactivity computed in spheroids (n = 200) vs. those recorded in the extracellular space. The LC3 and Lamp2 immunoreactivity in TH+ spheroids is shown in the D figures. D1-D4 and D5-D8 show two consecutive slices with a TH+ spheroid (D4 and D8; white arrow) showing LC3 (D2 and D6) but not Lamp2 (D3 and D7) immunoreactivity. The distribution of both markers in the soma of a striatal cell (useful to verify that the Lamp2 antibody was working) is indicated with a yellow arrow in D1-D3. The LC3, Lamp2 and TH immunoreactivity computed in spheroids (n = 200) vs. those recorded in the extracellular space is shown in D9. There was no LC3-Lamp2 co-localization in spheroids (D10).The phosphatidylserine (PS) immunoreactivity in spheroids is shown in the E figures. An example of a TH+ spheroid showing a marked PS immunoreactivity is shown in E1 and E2 respectively. The distribution and the co-localization of TH and PS immunoreactivity distribution across this spheroid is shown in E3 and E4 respectively. The LC3 and TH immunoreactivity computed in spheroids (n = 200) vs. those recorded in the extracellular space is shown in E5. The LC3-PS co-localization within spheroids (n = 25) is shown in E6. A4, A5, C3, C4, D9, E3 and E5 show the mean ± standard error. PC: Pearson’s correlation; OC: overlap coefficient; CR: co-localization rate.

