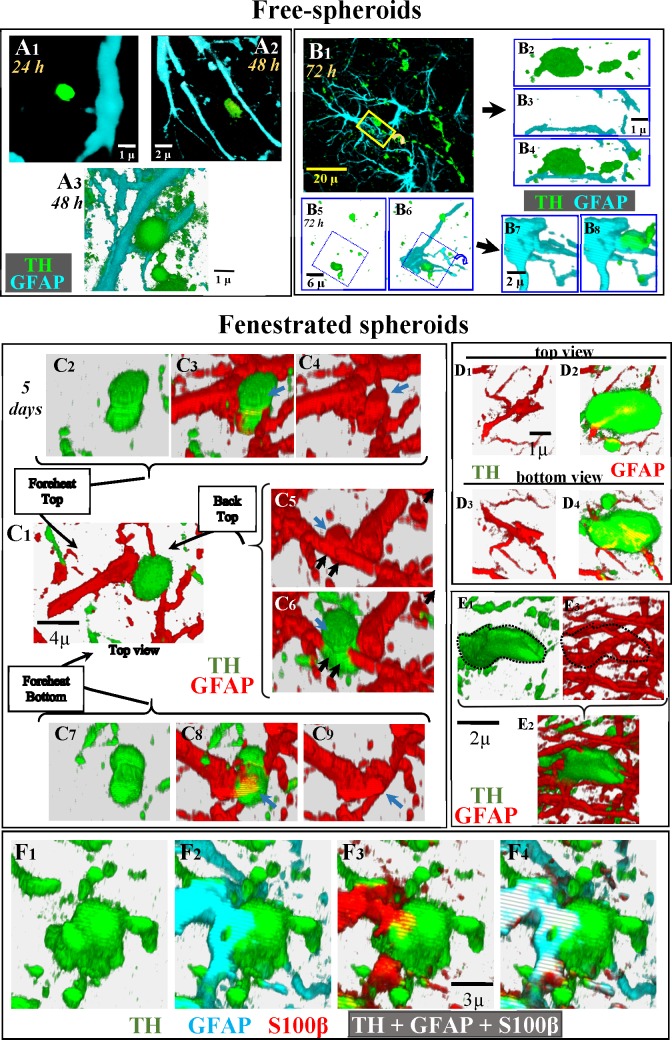
Fig 3. Identification of fenestrated-spheroids.
Figures in A show examples of the position of DAergic spheroids with respect to astrocytic processes 24 (A1) and 48 (A2 and A3) hours after 6OHDA administration. The figures in B show two examples of the position of DAergic spheroids with respect to astrocytic processes 72 hours after 6OHDA administration. B2-B4 show an amplification and rotation of the yellow square shown in B1. B7 and B8 show an amplification and rotation of the blue square shown in B5-B6. Images C2-C9 present different perspectives of the spatial relationship between a spheroid (green) and a process (red) of an astrocyte (C1), showing that the spheroid is crossed by the astrocytic processes (black arrows in C5 and C6) and that the astrocytic crossing process emits an additional process inside the spheroid which progresses longitudinally across the largest diameter of the spheroid (blue arrows in C3 vs. C4, C5 vs. C6 and C8 vs. C9). D1-D4 images show the top (D1, D2) and bottom (D3, D4) perspectives of a spheroid penetrated by an astrocytic process which ramified into two branches inside the spheroid. A spheroid penetrated by multiple astrocytic processes is shown in E1-E3 (the spheroid boundary is drawn with a dotted line in E1 and E3). Figs F1-F4 present a fenestrated spheroid where the co-localization of GFAP, and S100β inside a TH-immunoreactive spheroid is shown.

