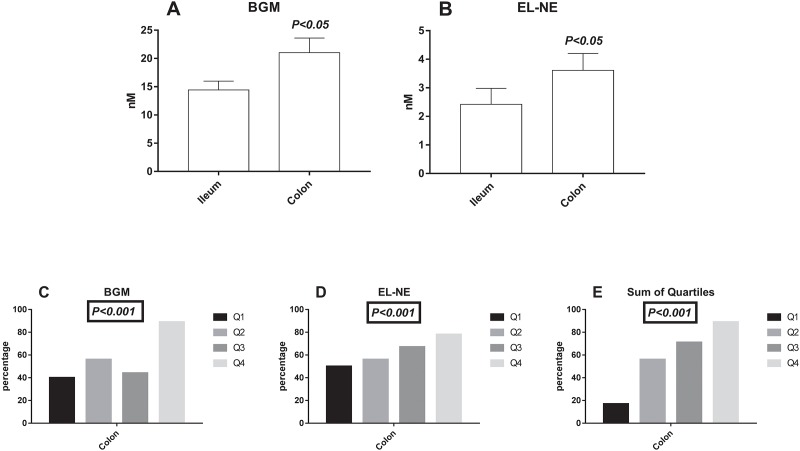
Fig 4. Serum levels of the ECM serum biomarkers BGM and EL-NE in relation to location in Crohn’s disease and the percentage of colon involvement as a function of the biomarker levels.
The biomarkers were divided into 25% quartiles (Q1, Q2, Q3, Q4), and consisted of 10, 9, 9, and 9 patients respectively. The cumulative sum of the both biomarkers was calculated in divided into quartiles of sum (Q1, Q2, Q3, Q4), and consisted of 5, 9, 13, and 9 patients respectively. A) BGM serum level in patients with colon and ileum involvement, B) EL-NE serum levels with colon and ileum involvement, C) percentage of colon involvement for BGM Q1, Q2, Q3, and Q4, D) percentage of colon involvement for EL-NE Q1, Q2, Q3, and Q4, E) percentage of colon involvement for the sum of quartiles Q1, Q2, Q3, and Q4. The error bars represent standard error of the mean (SEM). Student t-test was applied for figures A and B, the chi-squared test was applied for the figures C, D, and E.

