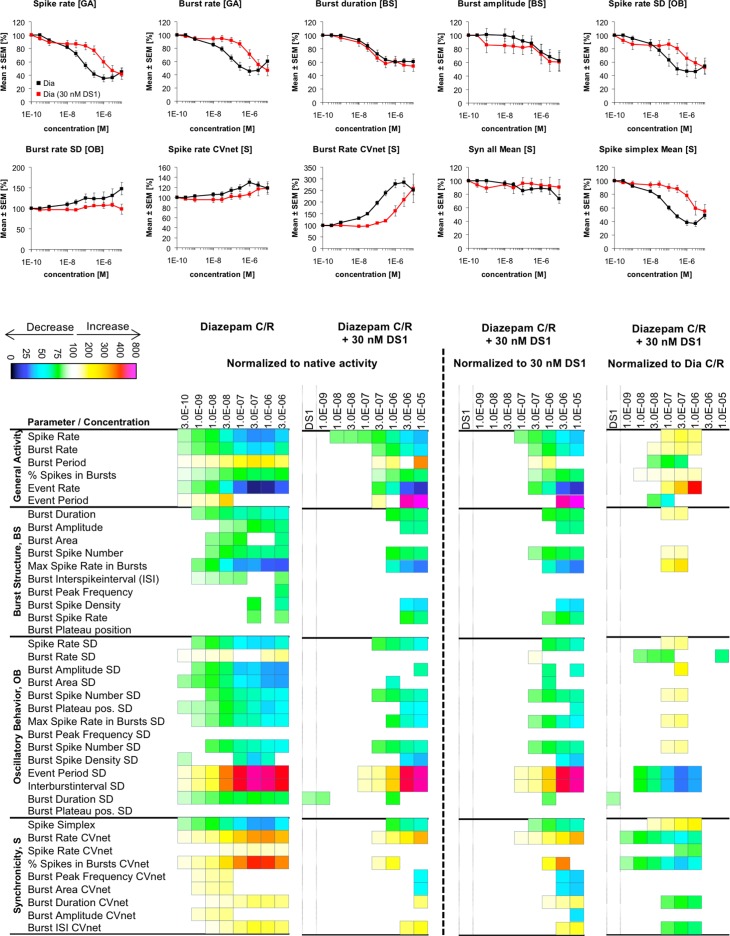
Fig 9. Changes in cortical network activity induced by 8–9 cumulatively increasing concentrations of diazepam in the absence and in the presence of 30 nM DS1.
The heat maps to the left of the vertical hatched line present statistically significant changes in 40 activity parameters relative to native activity (no drug, 100%) (Student’s paired t-test, p≤0.05). The concentration-response relationships for the drug combinations at 10 selected activity parameters are given as mean ± S.E.M. relative to native activity (no drug, 100%). The heat maps to the right of the vertical hatched line present statistically significant changes in the 40 activity parameters between the activity induced by a specific diazepam concentration co-applied with 30 nM DS1 relative to the activity induced by 30 nM DS1 on its own (100%) or relative to the activity induced by that specific diazepam concentration on its own (100%) (Student’s paired t-test, p≤0.05).

