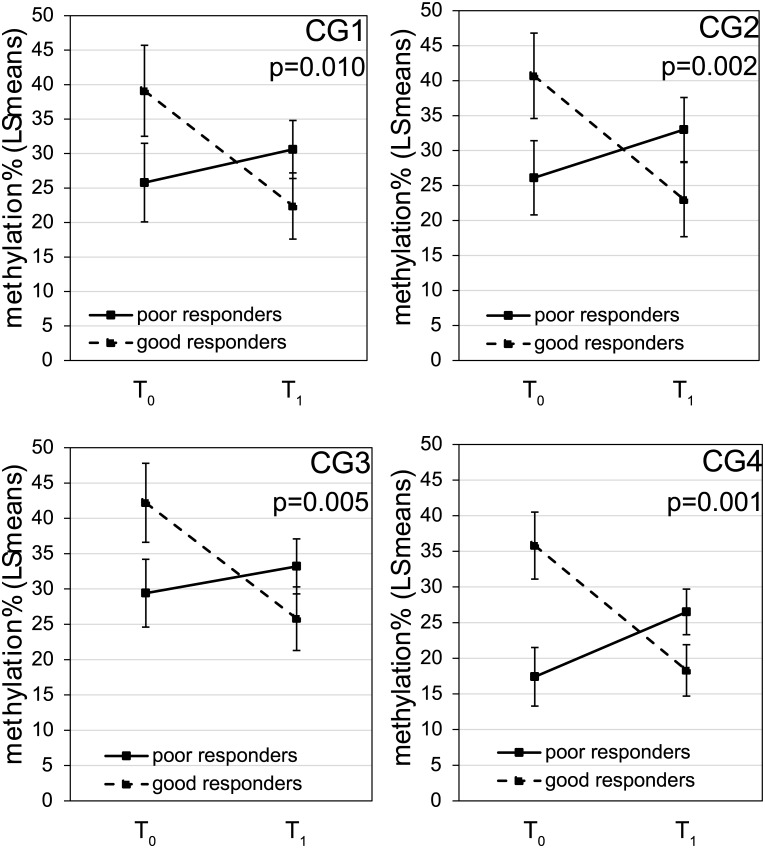
Fig 2. Promoter methylation of OTX2 showed differential changes in response to steroid treatment between good and poor responders.
The association of DNAm at 4 CpG sites located within the promoter region of OTX2 with time (T0 vs. T1) and responder status were tested using mixed models with age, sex and race being adjusted. Data shown were least square means with standard errors of the methylation% at T0 and T1 for good and poor responders respectively. P values were for the responder-specific T1-T0 changes.

