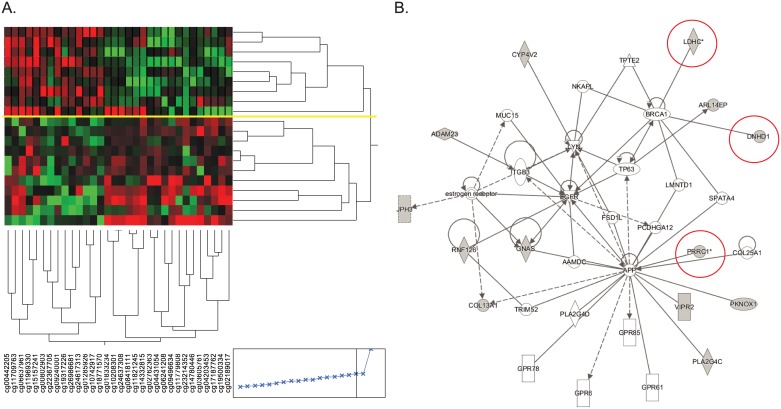
Fig 3. DNAm at 32 non-SNP CpG sites separate two responder groups.
A. Hierarchical clustering of participants based on DNAm (Ward’s minimum variance method, JMP). Yellow line represents the complete separation between good (top panel) and poor responders (bottom panel). B. Overrepresented network from IPA analysis. CpG sites located close to genes circled in red were selected for verification.

