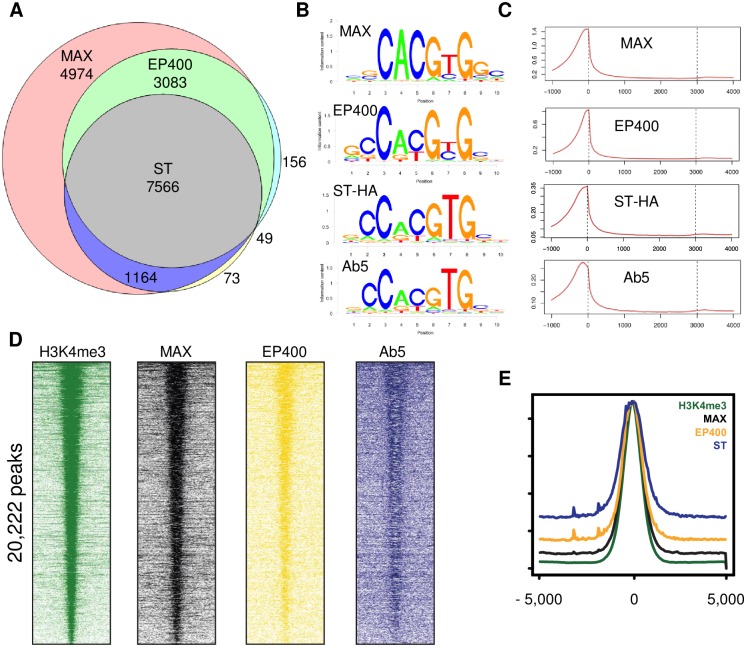
Fig 6. MAX, EP400 and MCPyV ST bind to actively transcribed promoters.
(A) Venn diagram of annotated genes corresponding to peaks identified by ChIP-seq with indicated antibodies. Two biological replicas of MAX and EP400 were performed and shared genes indicated. Shared genes identified with Ab5 and ST-HA are indicated. See also S6A Fig. (B) De novo DNA motif identification with indicated antibodies. (C) Distribution of peaks by Metagene analysis. (D) Heatmaps of H3K4me3, MAX, EP400 and ST (Ab5) ChIP peaks ranked by read density of H3K4me3 and scaled against the 75th percentile of genome-wide read density for each ChIP. (E) Meta-track analysis of ChIP-seq read density for MAX, EP400 and ST at all H3K4me3 peaks genome-wide. Regions are centered and ranked for H3K4me3 peaks over input.

