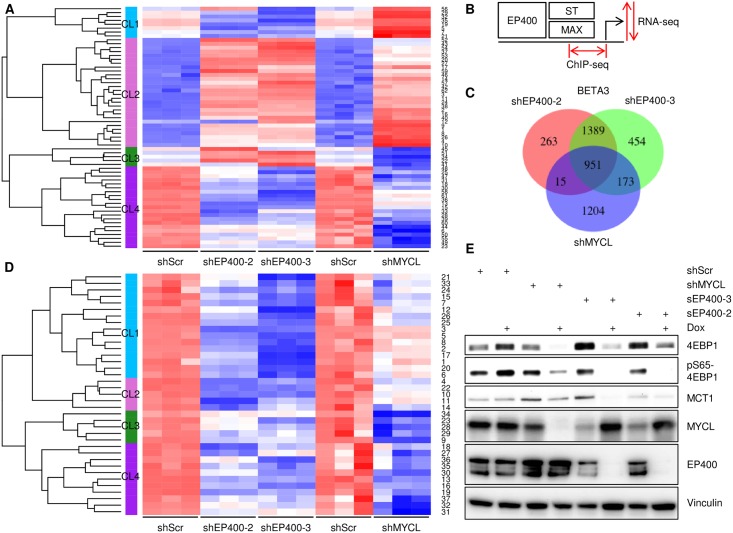
Fig 7. MCPyV ST cooperates with MYCL and EP400 complex to activate gene expression.
(A) Heatmap depicts average mean-centered and standard-deviation-scaled gene expression profiles for each of 62 clusters created by applying model-based clustering to the differentially expressed genes (DEG) in MKL-1 cells after depletion of EP400 or MYCL in comparison to shScr control. Model-based clusters (1–62) are labeled on the right-hand side and their gene members are listed in S3 Table. Merged Clusters (CL1-4) are indicated on the left-hand side. (B) Diagram illustrating BETA Activating/Repressing Function Prediction of transcription factors by correlation of distance of peaks from corresponding TSS obtained in ChIP-seq of ST, MAX and EP400 with changes in gene expression by RNA-seq after Dox-induction with shRNA targeting EP400 or MYCL. (C) Venn diagram showing common direct target genes of MAX, EP400 and ST identified by BETA based on ChIP-seq of MAX, EP400, ST and RNA-seq of shEP400–2, -3 and MYCL shRNA (BETA3). (D) Heatmap depicts average mean-centered and standard-deviation-scaled gene expression profiles for each of 37 clusters created by applying model-based clustering to the 951 BETA3 target genes in MKL-1 cells after depletion of EP400 or MYCL in comparison to shScr control. Model-based clusters (1–37) are labeled on the right-hand side and their gene members are listed in S3 Table. Merged Clusters (CL1-4) are indicated on the left-hand side. (E) MKL-1 cells containing Dox inducible shRNA for shScr, shMYCL or EP400 (shEP400-2, -3) were treated with dox for 5 days. Lysates were blotted with indicated antibodies. EP400 immunoprecipitations were blotted with EP400 antibody.

