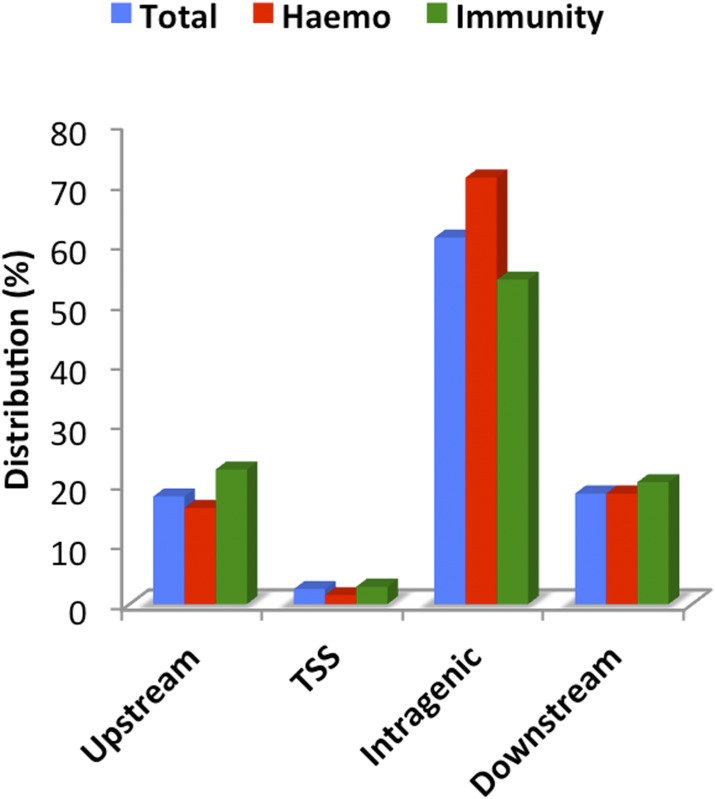
Fig 2. Genomic distribution of cis-regulatory sites relative to gene annotations.
Genomic distribution of proximal cis-regulatory sites relative to gene annotations. The distribution of sites proximal to hematopoietic (Hemo, red) and immunity genes (Immunity, green) is compared to the distribution of sites proximal to all gene annotations (Total, blue). Genomic regions were defined as upstream for up to two kilo bases upstream of the annotated TSS. The TSS fraction comprises from coordinate -60 to coordinate +40 base pairs from the TSS. Intragenic for the region +41 base pairs from the TSS to the 3-prime end. Downstream for the region including up to 2 kilo bases from the 3-prime end of gene annotations.

