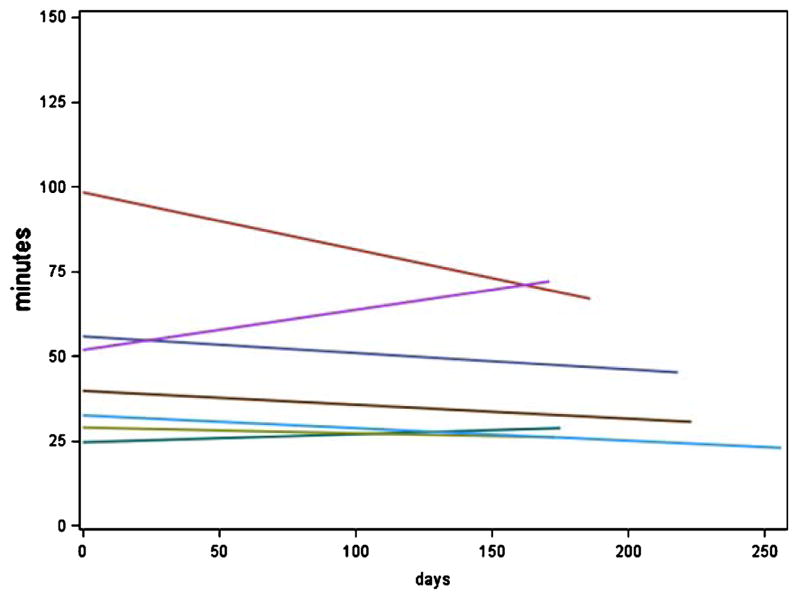
Fig. 2.

Total daily driving (in min) over time by cognitive group. Displays data from the MCI group. The y-axis shows the total daily driving in min (numbers are predicted min obtained from the mixed-effects models) and the x-axis shows days.

Total daily driving (in min) over time by cognitive group. Displays data from the MCI group. The y-axis shows the total daily driving in min (numbers are predicted min obtained from the mixed-effects models) and the x-axis shows days.