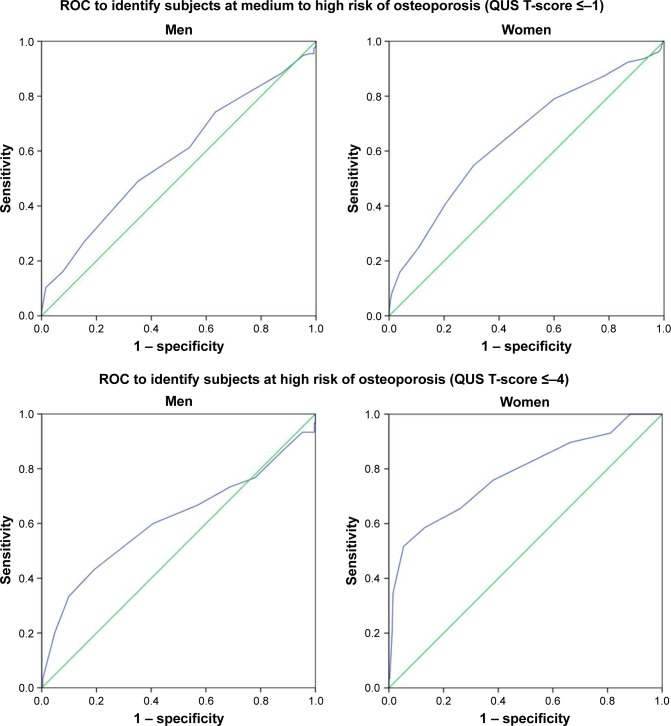
Figure 1.
ROC for identifying the optimal cut-off values for OSTA to identify subjects at risk of osteoporosis for each sex.
Notes: The diagonal line is the reference line and the blue line is the test line. The optimal cut-off value is determined by tracing the coordinates closest to a sensitivity value of 0.8 with a reasonable high 1 – sensitivity (specificity) value. That coordinate will translate to the optimal OSTA cut-off value.
Abbreviations: OSTA, osteoporosis self-assessment tool for Asians; QUS, quantitative ultrasound; ROC, receiver-operating curve.

