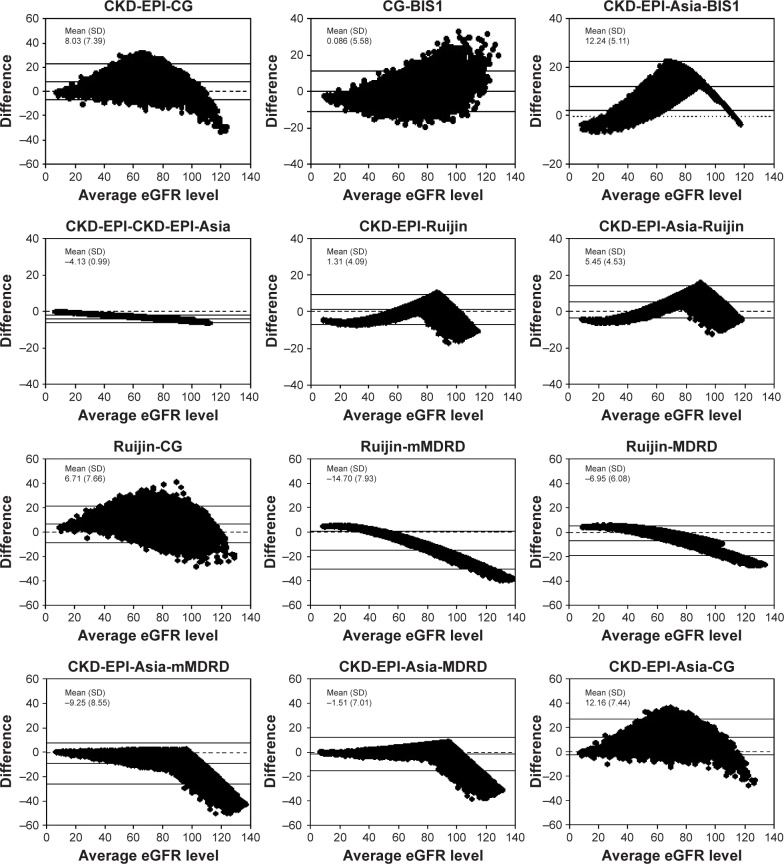
Figure 2.
The Bland–Altman plots showing the comparisons between different eGFR equations.
Notes: The average eGFR level between the two methods in mL/min/1.73 m2 (x-axis) is plotted against their difference (y-axis). Mean and SD of the difference are reported to quantify the extent of the bias.
Abbreviations: BIS1, Berlin initiative study 1 equation; CG, Cockcroft–Gault; CKD-EPI, chronic kidney disease epidemiology collaboration; eGFR, estimated glomerular filtration rate; MDRD, modification of diet in renal disease; mMDRD, MDRD modified for Chinese populations; Ruijin, Chinese Ruijin equation.

