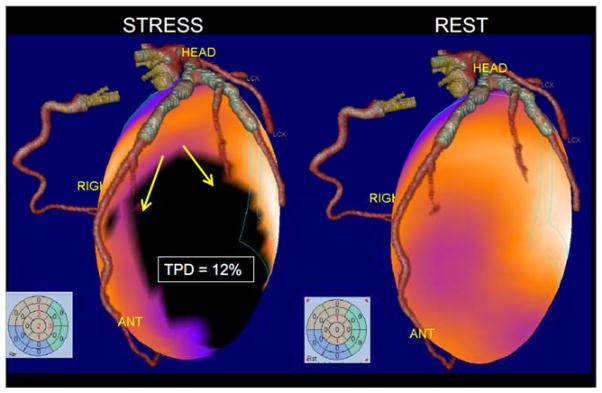
Figure 4.
Fusion of standalone CT angiography and MPS. Volume rendered 64-slice CTA fused with myocardial perfusion SPECT obtained on a different scanner at a different time. SPECT images show ischemia (3D blackout region on the left). Stress Total perfusion (TPD) was 12% in the territory supplied by the diagonal branches of LAD (as anatomically determined by CTA).

