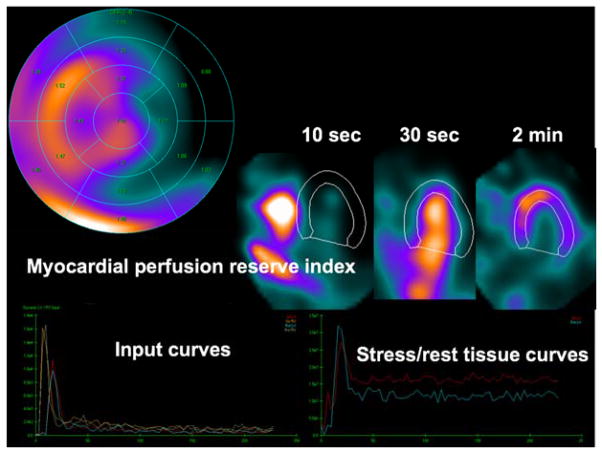
Figure 5.
Dynamic quantitative analysis of abnormal study obtained on D-SPECT system showing segmental analysis of myocardial perfusion index with segmental values (top left), dynamic images, myocardial perfusion SPECT images (top left), input curves (bottom left), and output stress and rest curves (bottom right). (Data courtesy of Marcelo Di Carli, Brigham & Women’s Hospital) With kind permission of Springer: Current Cardiovascular Imaging Reports, New Imaging Protocols for New Single Photon Emission CT Technologies, Volume 3, 2010, pp 162–170, Slomka et al. [81].

