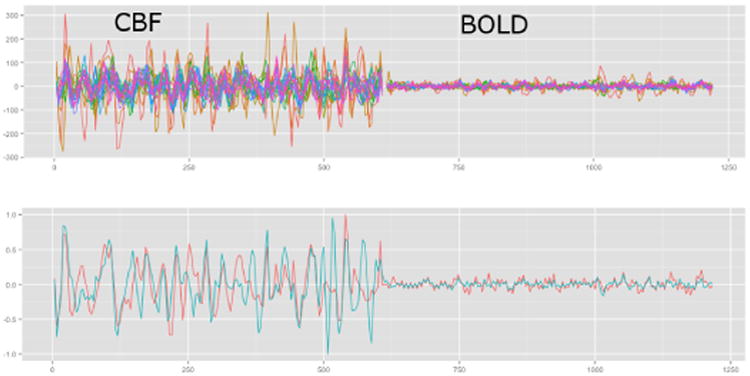
Fig. 1.

ASL signals in the cingulate gyrus of a normal individual showing ASL-CBF and ASL-BOLD in all voxels in the ROI (top). The average ASL-CBF and ASL-BOLD are illustrated on the bottom in red and the ASL-CBF and ASL-BOLD that result from using SCCA to examine connectivity with the hippocampus is shown in blue. Both signals on the bottom have been intensity normalized for visualization
