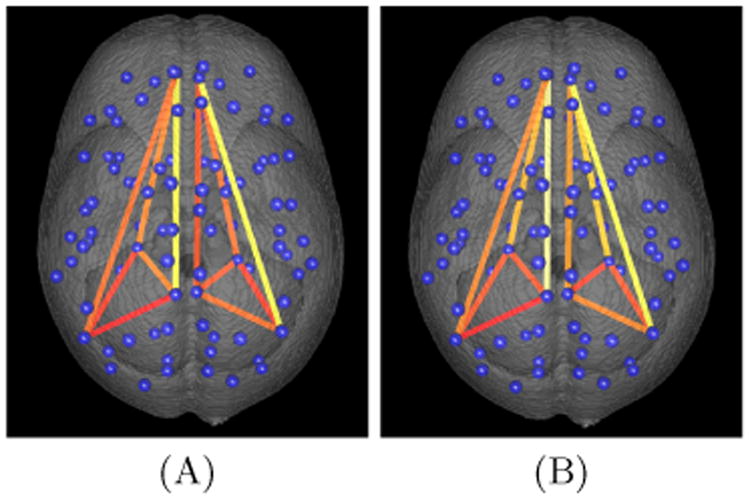
Fig. 2.

Intrahemisheric connectivity in the default mode network of an individual subject is visualized using A) ROI averaged combined CBF and BOLD and B) SCCA based combined CBF and BOLD. The centroid of all labeled regions are illustrated with blue spheres, and the connections in the DMN are illustrated with line segments. The connectivity matrix values are used along with heat-mapping to color the line segments where higher connectivity values result in “hotter” colors.
