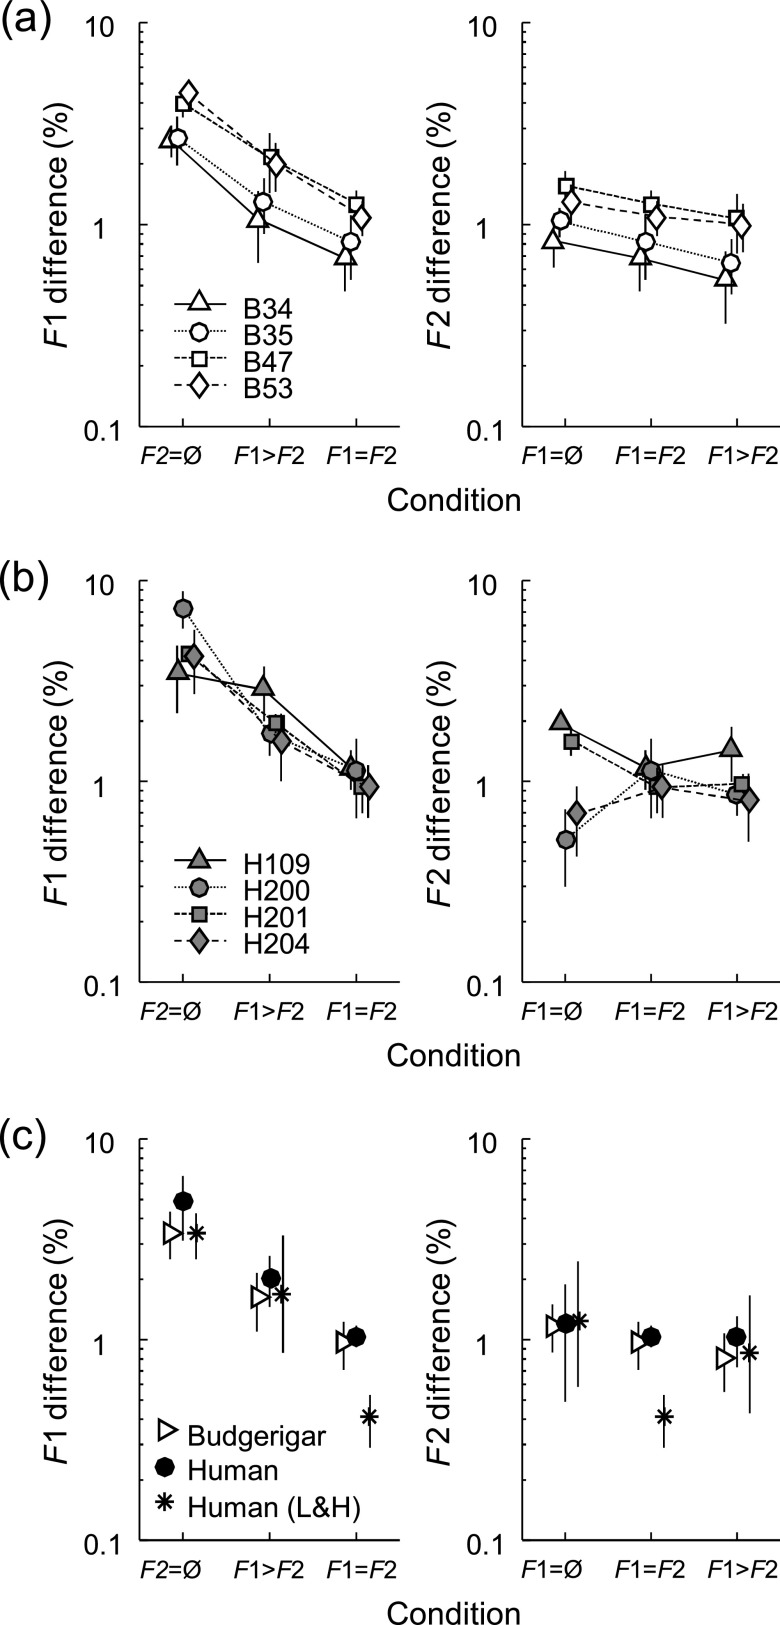
FIG. 4.
(a) Thresholds of individual budgerigars (n = 4) for discrimination of simultaneous changes in F1 and F2. The percent change in F1 was either equal to the percent change in F2 (F1 = F2 condition) or two times the percent change in F2 (F1 > F2 condition). Thresholds with respect to F1 (left panel) are plotted together with isolated F1 thresholds (F2 = Ø condition; left) and arranged left to right in order of increasing F2 change. Thresholds with respect to F2 are plotted with isolated F2 thresholds (F1 = Ø condition; left) and arranged left to right in order of increasing F1 change. The meaning of the symbols is the same as in Fig. 3(a). (b) Thresholds of individual human subjects (n = 4) for the same stimuli with simultaneously changing formant frequencies, presented as in (a). (c) Mean thresholds of budgerigars and humans in the present study, from individual data in (a) and (b), compared to human thresholds from a previous study (L&H: Lyzenga and Horst 1998). Error bars in all cases indicate the standard deviation across subjects.

