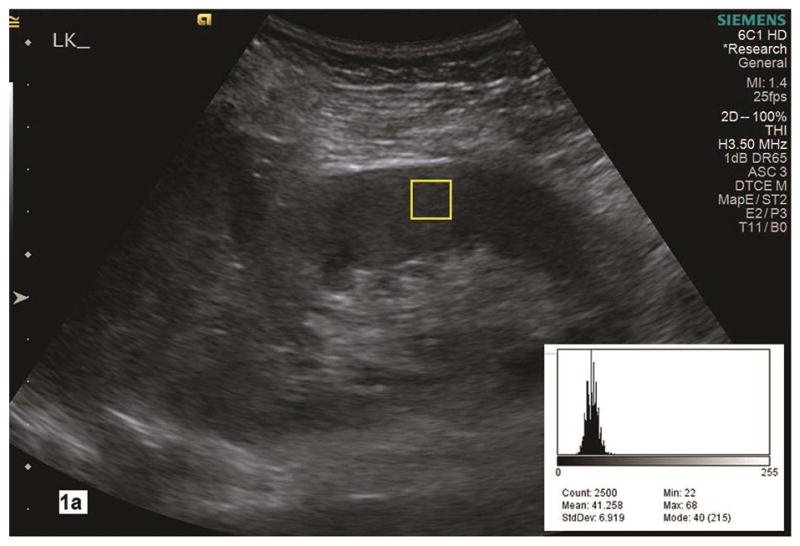
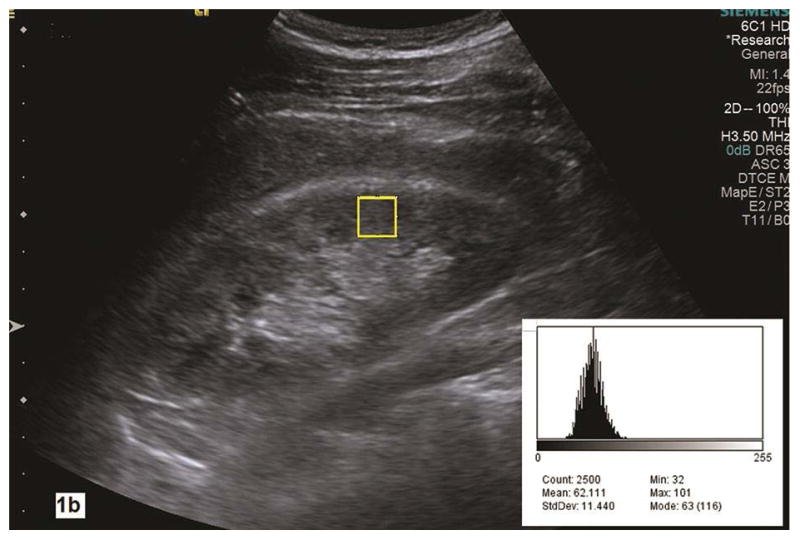
Fig. 1a–b.


Renal parenchyma pixel-intensity is measured in the grayscale image of a longitudinal section of the kidney with Image J analysis tool. A histogram (right lower corner) shows the value of pixel counts in the region of interest (yellow rectangle box, 2500 count) in the renal cortex. In the histogram, the Max is maximal pixel value and the Min is the minimal pixel value in the region of interest. Parenchymal maximal and minimal pixel-intensities measure 68 and 22 in 1a with pathologic mild CKD whereas they are 101 and 32 in 1b with pathologic moderate to severe CKD. LK, left kidney.
